2026.11.13
World Bank Scorecard Replication
Recently, I found a need to understand how the World Bank Group computes its Global Scorecard indicators. My usual approach in these situations is to replicate a few published observations from the raw data and documentation: To learn by reverse engineering. Fortunately, AI is making scientific replication easier, cheaper, and more effective (Schwartz et al. 2026), so this task only took an hour or so.
Below I provide some background to the World Bank Group scorecard. I then report what errors, inconsistencies, and ambiguities I found; how I found them; and some takeaways. In particular, I speculate how Toyota’s Poka-Yoke (“error-proofing”) system of shifting data quality controls upstream might help error proof scorecard data. This is applicable to many Fortune 500 companies too.
The World Bank Group is an international organization owned by 189 member countries. It provides loans, grants, risk insurance, and technical assistance to developing country governments and firms to foster economic development.
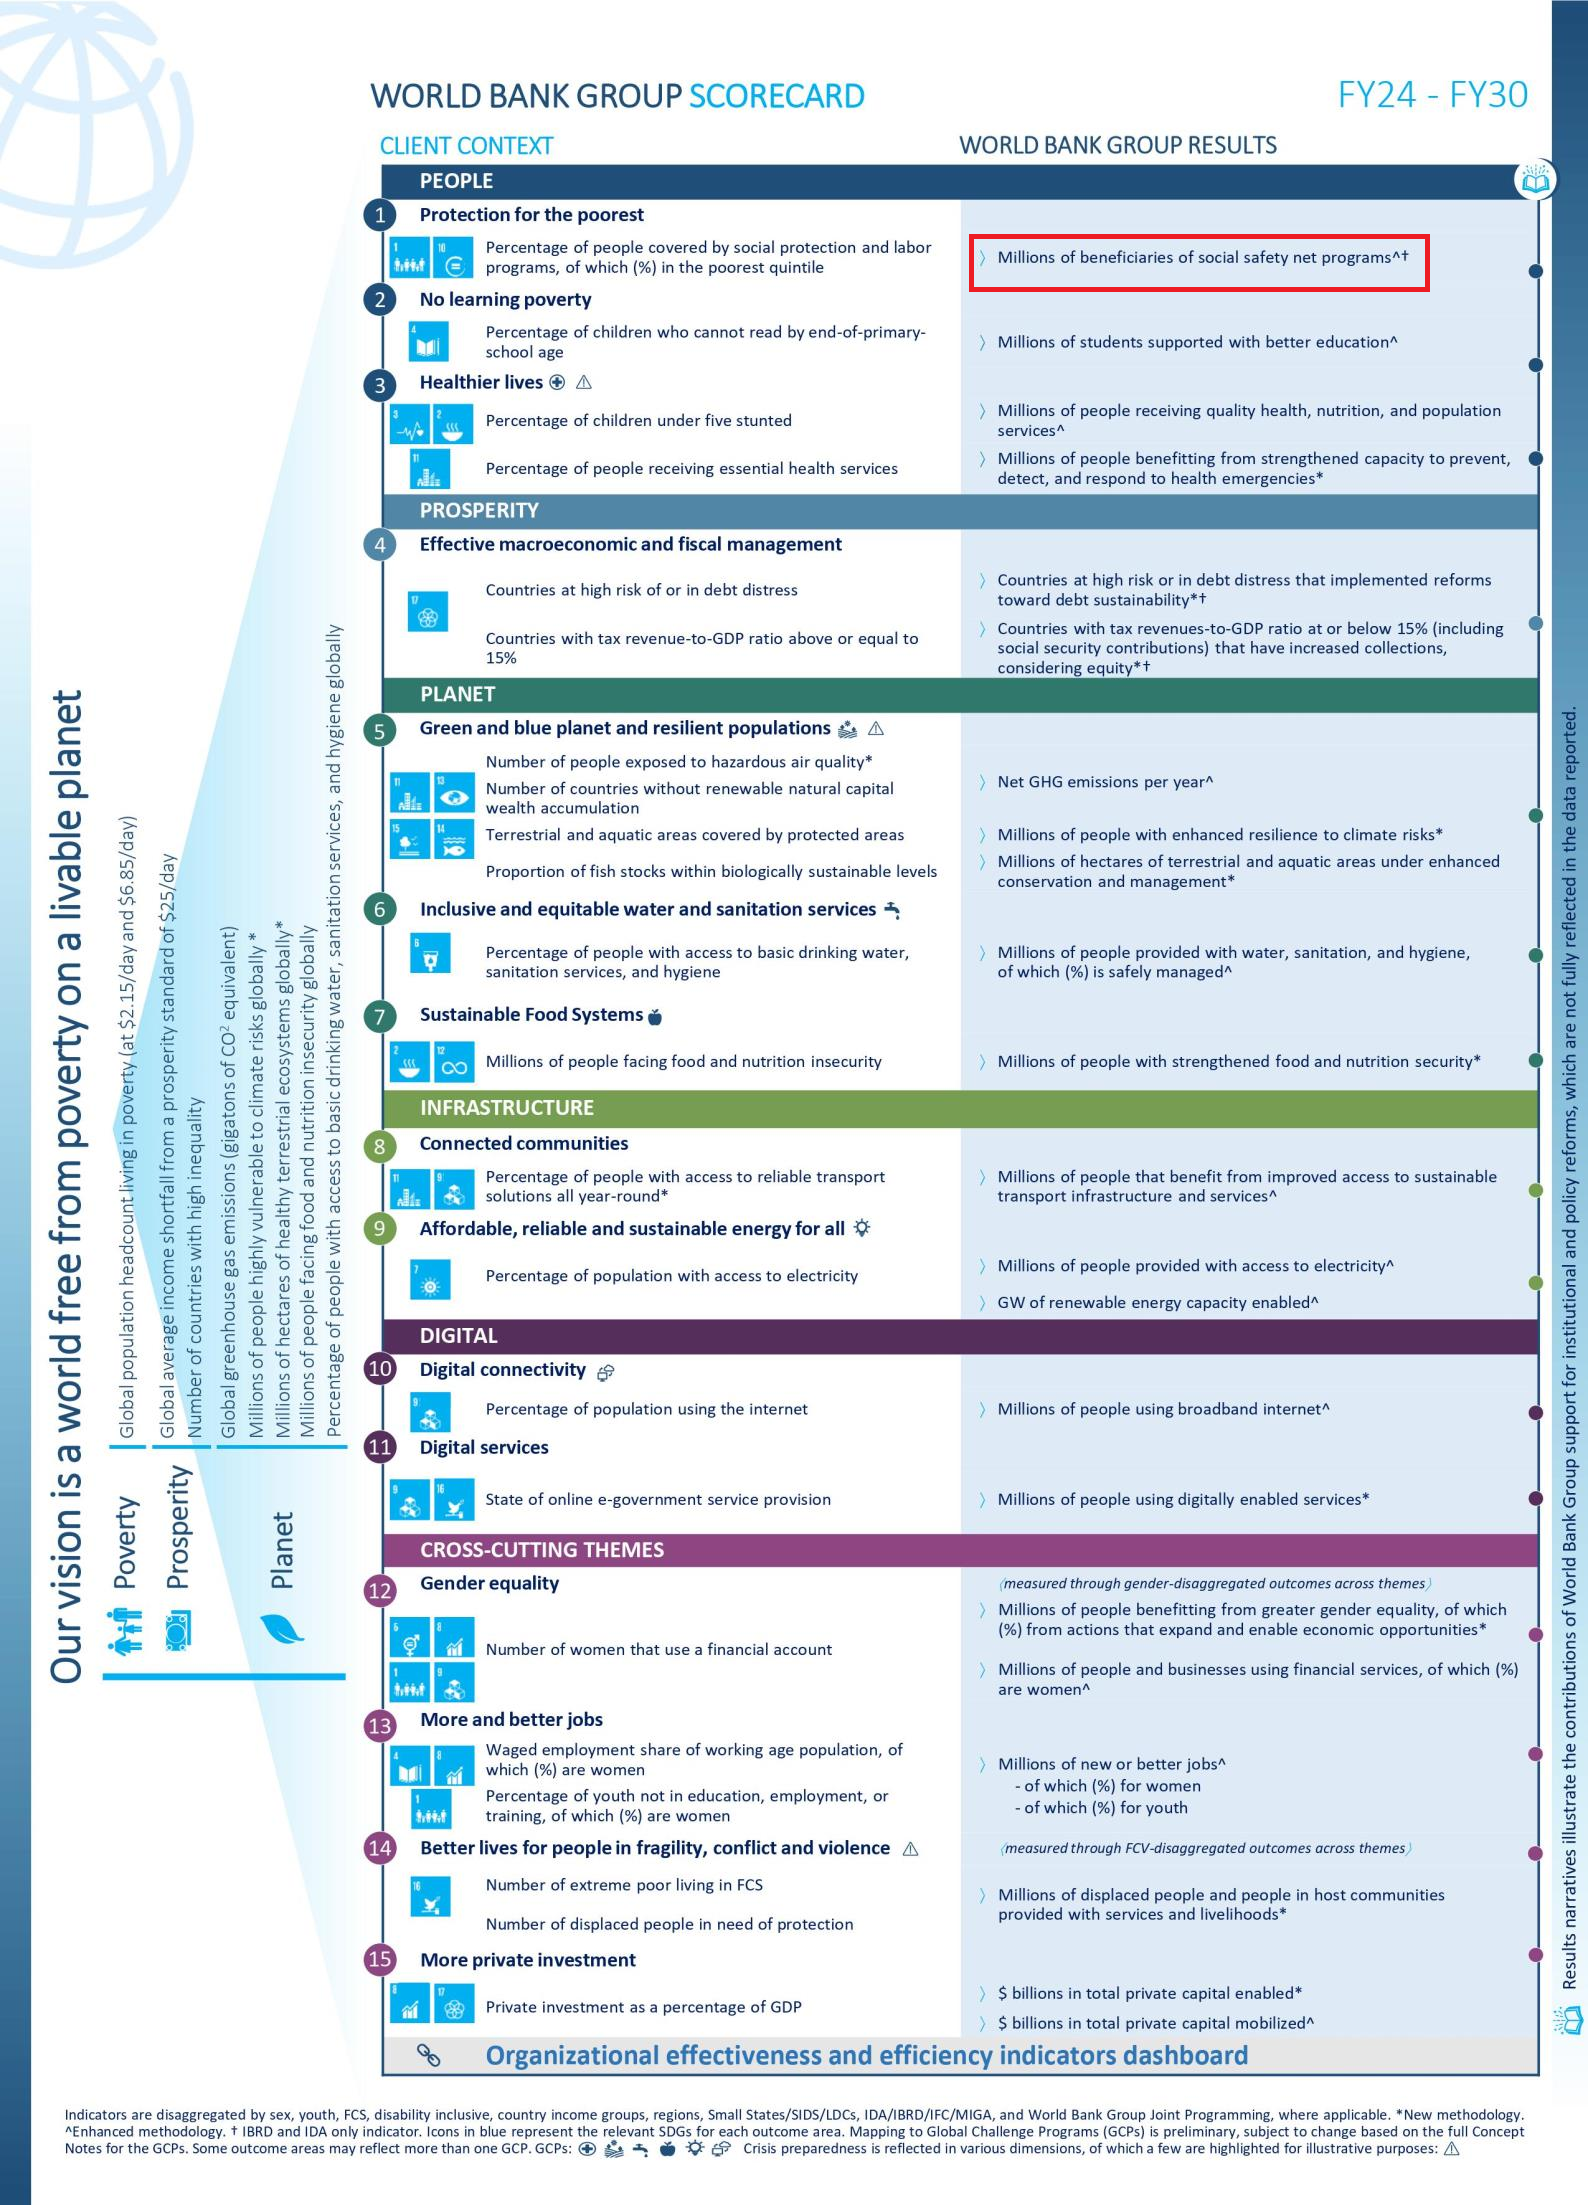
The World Bank Group Scorecard tracks what its operations achieve, and expect to achieve, across 15 outcome areas (see image below). In principle, it helps guide decisions and hold the institution accountable for improving people’s lives. In practice, the jury is still out (World Bank Group 2026).
To better understand the underlying data and workflow I set out to do a quick replication of the number of achieved and expected cumulative beneficiaries of social safety net programs in Afghanistan in 2026. As of June 2026, the report cutoff date, the scorecard reports that the active portfolio of projects had achieved a cumulative 10.9 million beneficiaries, with 11.6 million expected when the projects end. These, then, are the two numbers I set out to replicate using GPT-6.1 Sol High with the Opencode harness.
The data on the achieved and expected beneficiaries are generated as part of the regular World Bank workflow. At a high level, the workflow is as follows:
At the time these data were compiled the World Bank had three active social safety net projects in Afghanistan:
Hence, I set out to replicate the 10.9M Achieved and 11.6M Expected numbers above using only the documents from these projects, alongside the available methodology notes (PDF) and metadata.
I was not able to replicate the two numbers using only the available documents, guidance, and metadata. The reason is the reports themselves do not always answer the three questions outlined in Step 3 of the workflow above. Namely, which line items should map to the scorecard indicator, whether and how to adjust for double counting, and the average household size.
I was able to reproduce the two numbers by downloading the scorecard data in Excel, as the workbook specifies the indicator mapping, household size, and the correction for double counting, as shown in the table below (I kept the number of decimals as reported):
| Project | A: Reported achieved | B: Reported expected | C: Household conversion | D: Deduplication factor | Adjusted achieved (A × C × D) | Adjusted expected (B × C × D) |
|---|---|---|---|---|---|---|
| CRLP | 1,313,921 households | 1,400,000 households | 8.04 | 0.9532 | 10,069,533.157488 | 10,729,219.2 |
| EERA | 86,302 households | 86,000 households | 8.04 | 0.7721 | 535,735.544568 | 533,860.824 |
| HER | 431,032 people | 490,000 people | 1 | 0.7721 | 332,799.8072 | 378,329 |
| Total people | — | — | — | — | 10,938,068.509256 | 11,641,409.024 |
| Published precision | — | — | — | — | 10.9 million | 11.6 million |
After some digging, I found the household size number of 8.04 comes from Afghanistan’s 2015 Demographic and Health Survey, reported by the UN’s Department of Economic and Social Affairs.
I was not able to find any methodological explanation of how the specific deduplication factors were computed in this case. This is consequential, as these factors can have a large impact on the Achieved number. Put differently, I could replicate the numbers but not the methodology.
I also found some additional reporting inconsistencies and unresolved questions. Below the ChatGPT summary:
From my conversations with folks at Fortune 500 companies, one popular application of AI is using LLMs to derive value from unstructured data at scale, like project documents. A typical pipeline for this kind of application is shown below:
  block-beta
    columns 5
    A["Unstructured<br/>data"] space B["Document<br/>parsing"] space C["LLM-based<br/>extraction"]
    space:5
    F["Reports and<br/>dashboards"] space E["Structured<br/>data"] space D["Validation and<br/>reconciliation"]
    A --> B
    B --> C
    C --> D
    D --> E
    E --> F
This can be a major value unlock when the unstructured data is out of your control. However, if you control the unstructured data generation, a better solution might be to make it structured in the first place, at the point the data are generated.
The World Bank Group already does this to some extent, as far as I can tell. (I do not have access to the World Bank’s operational portal so my description below is my best guess. If you are familiar with the system, and want to share some comment or correction please contact me.)
Specifically, the Operational Portal (i.e. the structured web forms teams use to enter project data, and generate project reports) is a form of structured authoring that tries to create structured data at source, as illustrated below:
  block-beta
    columns 5
    A["Data entered<br/>in Operations Portal"] space B["Project reports<br/>/ structured data"] space C["Validation and<br/>reconciliation"]
    space:5
    space:2 E["Scorecard<br/>and dashboards"] space D["Aggregation"]
    A --> B
    B --> C
    C --> D
    D --> E
This is similar to the Poka-Yoke (“error-proofing”) system developed by Shigeo Shingo in the Toyota Production System (Shingo 2021). The starting premise is humans will always make mistakes. Hence, good systems should be designed so mistakes cannot occur. Unlike traditional quality control, where the output of a process is inspected for defects, the idea in the Poka-Yoke system is to prevent any defects in the first place. As popularly stated in quality management circles:
Quality should be built into the process, not inspected into the product.
Could the reporting inconsistencies and unresolved questions outlined above be evidence of a possibly under-specified Operational Portal? If so, AI could help address these issues in a number of ways.
First, by dramatically reducing the cost of software development, updates to harden the Operational Portal, if needed, ought to be cheaper and faster. Second, AI agents can extend the input validation suite by adding semantic understanding where needed. Third, AI agents could help team members enter the data correctly at source. Together, they could help establish indicator mappings, units, household-size assumptions, and deduplication methods more robustly.
I want to end with a speculative takeaway: When the unstructured data are under your control, maybe the best use of AI is not to structure it, so much as to prevent its creation in the first place. To treat unstructured data as defects to be corrected at source.
Enjoyed this post? Subscribe via RSS to get new articles delivered to your feed reader.
Schwartz, Matthew, Isaiah Andrews, and Jesse Shapiro. 2026. An LLM Workflow That Reproduces, Improves, and Extends Published Economics Research. National Bureau of Economic Research; NBER. https://doi.org/10.3386/w35782.↩
Shingo, Shigeo. 2021. Zero Quality Control: Source Inspection and the Poka-Yoke System. Routledge.↩
World Bank Group. 2026. Counting What Counts? A Formative Evaluation of the World Bank Group Scorecard. Independent Evaluation Group; World Bank Group; Washington, DC: World Bank. https://doi.org/10.1596/ieg215793.↩